
Discover how our data-driven reporting solution helps Estonian companies understand their data, increase business value, monitor management KPIs and reflect results in real time — so you can gauge business progress, develop customer relationships and assess areas of risk.
Discover how our data-driven reporting solution helps Estonian companies make sense of their data, grow business value, track management KPIs and reflect results clearly in real time — letting you gauge business progress, develop customer relationships and assess areas of risk.
Data-driven reporting makes life easier
Today, most Estonian companies are still struggling to make sense of their data and to find ways of turning it into business value. Reporting is definitely something that can be shaped so that a company’s management KPIs are under control and can be tracked at any moment, regardless of the tool being used. Targets are often the basis for performance bonuses, too, and tracking them should be accessible to all key people so they can adjust what they are doing as they go. It is important that results are reflected clearly and understandably. The solution we have developed lets you query data in real time, based on the data as it is entered.
Benefits of reporting:
A sense of business progress — clarity on which direction the business is heading. Whether it is growing or shrinking, you win either way, because you know — and knowing means you can make decisions about what comes next.
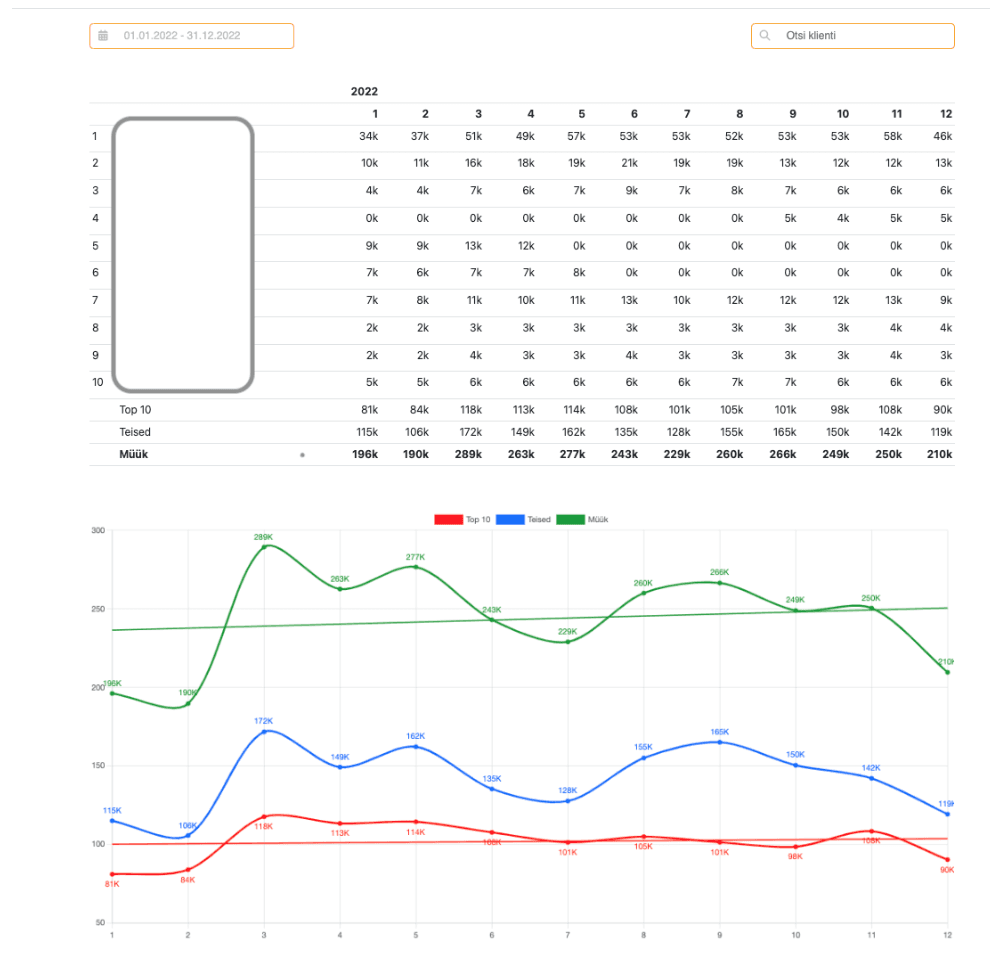
How much of your turnover comes from your top customers? If one customer’s share is too large compared with the others, that is a risk for the company.
An overview of how each customer relationship is developing. The report gives a clear picture of how a customer relationship is evolving — whether volumes are growing or shrinking. If you see a downward trend, you can plan ahead: decide whether to invest in the relationship to restore volume, or find a replacement elsewhere.
Customer specifics — seasonality. This helps you understand how a customer’s business works. For example, mulled wine sales start when the first snow falls, and patio furniture sales start when the snow melts and the grass turns green.
Comparing customers with each other. Everyone’s capacity is limited! You can’t do everything, and sometimes you have to make choices. To serve one customer more, you sometimes have to give something else up. Reporting lets you view the dynamics of two different customers on a single chart to see how they are developing.
Tired of planning transport in Excel?
See for yourself how Planlogi can make your work easier.
Frequently asked questions
What is data-driven reporting?
Data-driven reporting means turning the data you already enter into clear, real-time reports on business performance, so management KPIs can be tracked at any moment.
Why should a transport company track revenue per customer?
If too large a share of turnover comes from one or a few customers, the business is exposed to risk. Reporting shows each customer’s share so you can spread that risk.
How does reporting help manage customer relationships?
Reports show whether volumes with each customer are growing or shrinking, so you can decide early whether to invest in the relationship or find replacement volume elsewhere.
Can reporting show customer seasonality?
Yes. Comparing volumes over months and years reveals seasonal patterns in a customer’s business, which helps with capacity planning and pricing.
Does Planlogi include reporting?
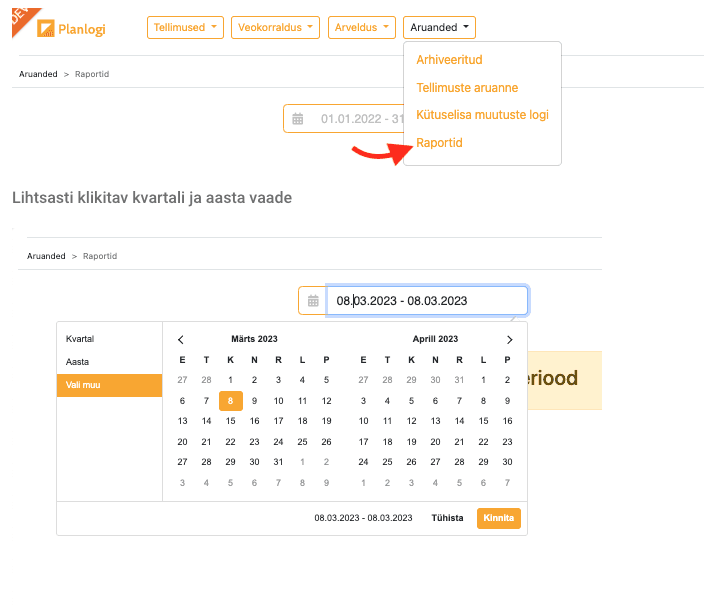
Yes. Planlogi TMS includes reports on orders and sales by period and by customer, including a comparison of your top 10 customers against all others.


